By Wu Peng, Senior Process Instrumentation Engineer · Last reviewed September 2, 2026
Coke oven gas flow measurement means metering a fuel gas that is roughly 55 to 62 percent hydrogen, 24 to 27 percent methane and 5 to 7 percent carbon monoxide. Its density is near 0.45 kg/Nm³. The pipelines run anywhere from a few kilopascals above atmosphere to about 3.5 bar, and tar and naphthalene coat every wetted surface they can reach.
The meters that hold up are ultrasonic (clamp-on, insertion or spool), V-cone and wedge elements on the differential pressure side, and averaging pitot tubes on large mains. Thermal mass meters only belong on branches where the composition stays fixed.
The numbers matter. Coke oven gas carries close to 18 percent of the energy that goes into a coke plant. On a 20,000 Nm³/h header a 10 percent metering error is worth about 9.7 MW, or 85 GWh a year of fuel charged to the wrong department.
This guide covers the gas itself, the five places it gets metered, the standard-volume and energy arithmetic, the sound-speed setting for hydrogen, where naphthalene deposits, and which meter to put where. It is about plant pipelines in DN200 to DN1500, not laboratory rotameters.
Contents
- Coke oven gas basics
- Composition and properties
- Five metering points
- Standard volume correction
- Energy flow in megawatts
- Sound speed and hydrogen
- Naphthalene and fouling
- Thermal mass and composition
- Hazardous area rating
- Selecting the meter
- FAQ
Coke oven gas basics
Coke oven gas (COG) is the by-product of carbonizing coal at around 1,000 °C in a coke battery. A tonne of dry coal yields about 300 Nm³ of clean gas after treatment. The raw gas leaves the oven chambers at close to 1,100 °C and is quenched with flushing liquor to about 80 °C in the collecting main. At that point it is water-saturated, with 46 to 48 percent water vapor by volume.
Primary coolers take it down to roughly 25 to 35 °C. An exhauster then moves it through the by-product plant, where tar, ammonia, naphthalene, benzol and hydrogen sulfide are stripped out. What comes out the other end is a clean fuel gas that goes to a gas holder and then to consumers.
Roughly 70 percent of that gas is burned inside the steelworks in hot stoves, reheating furnaces and boilers. About 15 percent goes back to underfire the coke ovens, and the rest runs power generation. Every hand-off is an allocation boundary, so the plant needs a number it can defend at each one.
The gas has a flammable range of 4.4 to 34 percent in air, and its carbon monoxide is toxic well below that range. Those two facts shape the meter choice as much as the flow physics do.
Composition and properties
Composition is the first thing to pin down. It moves from plant to plant, and from shift to shift, with the coal blend and the carbonization temperature. The ranges below combine a four-plant survey published by the IFRF with steel-industry reference data for clean gas.
| Component | Typical clean COG, percent by volume | Range seen across plants |
|---|---|---|
| Hydrogen, H2 | 55 to 62 | 42 to 65 |
| Methane, CH4 | 24 to 27 | 17 to 34 |
| Carbon monoxide, CO | 5 to 7 | 4.5 to 7.5 |
| Nitrogen, N2 | 3 to 6 | 1.2 to 18 |
| Carbon dioxide, CO2 | 1 to 2 | 0.2 to 3.5 |
| Heavier hydrocarbons, CnHm | 2 to 3 | 0.2 to 5 |
Sources: IFRF Combustion Handbook four-plant survey; IspatGuru clean-gas ranges. Raw gas before the by-product plant also carries H2S, NH3, HCN and benzene at tenths of a percent each.
Take a representative analysis: 58 percent H2, 26 percent CH4, 6 percent CO, 5.5 percent N2, 2 percent CO2, 2.25 percent C2H2 and 0.25 percent O2. The mixture then works out as follows. I calculated these from component data rather than copying a catalog figure, so you can repeat the arithmetic with your own gas analysis.
| Parameter | Specification |
|---|---|
| Molar mass | 10.1 g/mol (air 29.0) |
| Density at 0 °C, 101.325 kPa | 0.45 kg/Nm³; published range 0.45 to 0.50 kg/Nm³ |
| Relative density, air = 1 | 0.35 |
| Lower heating value | 17.6 MJ/Nm³ calculated; published 17 to 19 MJ/Nm³ (4,000 to 4,600 kcal/Nm³) |
| Gross heating value | 19.2 to 22.1 MJ/Nm³ |
| Wobbe index, net | 29 to 34 MJ/Nm³, close to natural gas because the light hydrogen offsets the low heating value |
| Speed of sound at 20 °C | about 574 m/s (1,880 ft/s); air is 343 m/s |
| Flammable range in air | 4.4 to 34 percent, clean gas |
Calculated values assume ideal-gas behavior at the analysis shown; they shift with every change in the nitrogen and methane fractions. Treat them as the check on your own gas chromatograph data, not as a substitute for it.
Five metering points
Nobody meters coke oven gas in the abstract. The gas is metered at five kinds of location, and pressure, temperature and dirt load differ at each one. A meter that is right at the booster discharge is wrong at the collecting main.
The table is the shortest way I know to end the argument about which technology is best. It depends on where the tap is.
| Metering point | Pressure and temperature | What fouls the meter | Meters that survive |
|---|---|---|---|
| Collecting and suction main (raw gas) | About 10 mm H2O (0.1 kPa); 80 °C, water-saturated | Tar fog, condensing water, ammonia corrosion | Rarely metered for allocation; clamp-on ultrasonic for trend only |
| Exhauster discharge, before or inside the by-product plant | 5 to 25 kPa; 25 to 35 °C after the primary cooler | Naphthalene crystals, residual tar | Insertion ultrasonic (retractable), V-cone, wedge |
| Clean gas header to the gas holder | 2 to 50 kPa; ambient | Light naphthalene film, water at cold spots | Ultrasonic spool or insertion, averaging pitot on DN800 and up |
| Booster discharge to consumers | Up to about 3.5 bar; ambient to 40 °C | Compression can re-crystallize naphthalene | Ultrasonic spool, V-cone, vortex if the gas is clean enough |
| Hot process lines, reheating furnaces and mixed-gas lines | 1 to 3.5 bar; up to about 350 °C on some mixed-gas process lines | Heat on the electronics, moisture, shifting composition | DP element with remote transmitter, high-temperature insertion probe |
Pressures and temperatures are typical values gathered from published application notes and plant descriptions; confirm yours from the P&ID before sizing anything.
Standard volume correction
Every meter in the table above except a thermal mass meter reports actual volume at line conditions. Allocation, underfiring control and boiler efficiency all want standard volume (Nm³, at 0 °C and 101.325 kPa) or, better, energy. The conversion is the ideal-gas ratio. At coke plant pressures it is worth doing by hand once, so the size of the correction sinks in.
Qn = Qa × (Pabs / 101.325) × (273.15 / TK)
Booster discharge at 40 kPa gauge and 35 °C: factor = (141.325 / 101.325) × (273.15 / 308.15) = 1.236. A meter reading 10,000 m³/h actual is delivering 12,360 Nm³/h.
Same line after a booster at 3.5 bar gauge and 40 °C: factor = 3.885. Clean gas header at 2 kPa gauge and 25 °C: factor = 0.934, and here the temperature term does almost all the work.
Two things follow. First, at low-pressure points a fixed pressure assumption costs little. A 15 K seasonal swing in gas temperature, though, moves the answer by 5 percent, so the temperature input has to be live rather than a configured constant. Second, the water basis matters upstream of the coolers.
Raw gas at the collecting main is 46 to 48 percent water vapor, so a wet Nm³ there contains only about 0.53 Nm³ of dry gas. Compare a raw-gas meter with a clean-gas meter on the wrong basis and the two disagree by nearly a factor of two before either meter has made an error. Where the arithmetic is done is covered in our guide to pressure and temperature compensation; the basis question is covered under mass flow versus volumetric flow.
Energy flow in megawatts
The plant manager does not want Nm³/h. He wants to know how many megawatts went to the hot stoves and how many to the power plant. Multiply standard volume by lower heating value and divide by 3,600 to get from MJ/h to MW.
P (MW) = Qn (Nm³/h) × LHV (MJ/Nm³) / 3,600
20,000 Nm³/h × 17.5 MJ/Nm³ / 3,600 = 97.2 MW. A 5,000 Nm³/h reheating furnace branch = 24.3 MW.
Now the part that flow meters cannot see. Clean COG nitrogen ranges from about 1 to 18 percent, depending on how much air leaks into the battery and the by-product plant. Hold the combustible ratios fixed and let nitrogen displace them: the heating value moves from 18.4 MJ/Nm³ at 1.2 percent N2 to 15.2 MJ/Nm³ at 18 percent N2. That is a 17 percent drop in delivered megawatts with no change at all in the Nm³/h reading.
If the allocation is in energy, the gas chromatograph or a calorimeter is part of the metering system, not an option. One published plant found that a department billed on a ±10 percent estimate was paying for gas it never received. On our 20,000 Nm³/h example that band is ±9.7 MW, about 85 GWh over a year. Totalizing the number in the right units is covered in flow totalizer versus flow meter.
Sound speed and hydrogen
Transit-time ultrasonic meters are the default for clean COG. Nothing has to sit in the gas, the turndown is wide, and the volumetric reading does not depend on composition. The speed of sound does depend on composition, and on this gas it is nowhere near the value for air or natural gas. For an ideal gas mixture:
c = √(γ R T / M)
With M = 10.1 g/mol and γ = 1.36 for the analysis in the properties table, c at 20 °C = 574 m/s (1,880 ft/s), 1.7 times the value for air. It rises about 1.7 percent for every 10 K of gas temperature.
A published application note on a 30 in COG line at a steel plant is the clearest field illustration I know of. The factory estimated 1,900 ft/s from the customer’s gas analysis. Once installed, the meter’s diagnostics read 1,725 ft/s, about 10 percent lower, and the unit was reprogrammed to the measured value. The gap means the real gas was heavier than the analysis on paper.
More nitrogen, more carbon dioxide or simply more water vapor all pull the sound speed down. Two lessons follow. Transducers on a hydrogen-rich gas sit closer together than on natural gas for the same path; that installation used 9 in on a 30 in pipe. And the sound-speed readout is a free diagnostic.
If that readout drifts by 5 percent between shifts and the temperature has not moved, the hydrogen fraction has. Natural gas transmission meters already use that trick to estimate blended hydrogen from the sound speed.
On the instrument side there are three choices. A clamp-on ultrasonic flow meter gives a fully non-intrusive install. An insertion ultrasonic flow meter suits a thick or lined wall. A dedicated ultrasonic gas flow meter spool with pipe-mounted transducers suits the booster discharge.
Naphthalene and fouling
Naphthalene is the reason COG metering has a bad reputation, and the mechanism is thermodynamic, not mechanical. Gas entering the primary coolers carries 9 to 11 g/m³ of naphthalene vapor and leaves with 2 to 4 g/m³. The equilibrium content is 3.48 g/m³ at 40 °C and only 1.29 g/m³ at 30 °C, a 63 percent drop across 10 K. Any surface that runs cooler than the gas becomes a condensation site: an uninsulated probe, a flange, the cold end of a probe near the wall.
Compression at the booster pushes the same equilibrium the other way and can crystallize naphthalene that stayed in the vapor phase at 20 kPa. The meters that last have wetted surfaces that do not exist, or can be withdrawn and cleaned without a shutdown, or are large and open enough that a deposit does not change the measurement.
| Technology | Wetted surface in the gas | What a deposit does, and the fix |
|---|---|---|
| Clamp-on ultrasonic | None | Internal wall coating attenuates the signal; watch signal strength, not the flow reading. Limited to pipe materials and pressures that transmit sound well. |
| Insertion ultrasonic, insertion thermal | Retractable probe through a ball valve | Coating shifts the signal or the heat transfer; pull and clean on a schedule, quarterly is a common starting interval. |
| V-cone, wedge | Large open element, permanent | Flow past the element scours it; a thin film changes the coefficient by a fraction of a percent. Purge the impulse lines. |
| Averaging pitot | Multi-port probe, permanent or retractable | Ports plug first; needs continuous nitrogen purge on dirty gas. Good on large mains at low pressure loss. |
| Vortex | Bluff body and sensor, permanent | Deposit changes the shedding frequency and eventually loses the signal; only after the by-product plant, and only where velocity stays above the meter’s minimum. |
| Orifice plate | Sharp edge, permanent | Edge fouls and the plate needs pressure that most COG lines do not have; one published plant ruled it out because the whole line pressure was under 25 kPa. |
Ordered from least to most exposed. The product pages for the V-cone flow meter, the wedge flow meter and the averaging pitot tube flow meter carry the pressure and size limits.
Thermal mass and composition
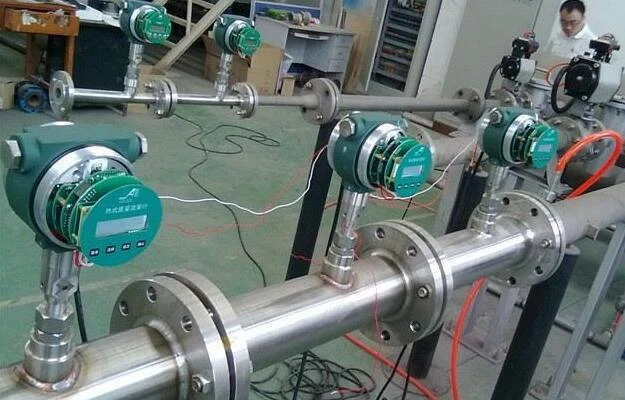
Thermal mass meters are attractive on paper because they read standard volume directly with no pressure or temperature inputs. The reading, though, is a heat-transfer measurement. Heat transfer depends on the thermal conductivity, heat capacity and density of the gas, and the meter is calibrated with a factor for one composition.
Move the hydrogen from 42 to 65 percent and the nitrogen from 1 to 18 percent, both inside the published range for clean COG, and the calibration no longer describes the gas in the pipe. Several manufacturers also exclude acetylene from their gas lists, and raw COG carries around 2 percent of it. So a thermal mass flow meter belongs on COG only where the composition is pinned.
That means a branch fed from a single analyzed source, a pilot or purge line, or a mixed-gas station where the blend is controlled and the meter can be re-factored when it changes. On the main headers the composition is whatever the battery made that shift. Use a volumetric meter there and correct with live pressure, temperature and heating value.
Application example
Steel plant, Philippines. An oxy-cutting unit needed to monitor the oxygen and fuel gas consumed on two DN25 supply lines, both fed from fixed supplies with stable composition at the point of use. Two DN25 thermal mass flow meters were proposed, one per line, after the oxygen-compatibility and installation points had been clarified with the plant; the inquiry is at the technical-clarification stage. This is the type of branch where thermal mass fits. On a variable-composition fuel gas header the same instrument would not be the first choice.
Hazardous area rating
Hydrogen at 50 to 65 percent puts coke oven gas in gas Group IIC under the IEC zone system and Group B under the North American division system. That is the most demanding category there is, and it removes options. Some clamp-on gas transmitters are certified for Zone 2 or Division 2 only. If the tap is inside a Zone 1 boundary they are out, however well they measure.
The usual answers are insertion and spool meters with Ex d or Ex ia electronics, or a DP element with the transmitter mounted outside the classified boundary. How to read the boundary is covered in our guides to Class 1 Division 1 versus Division 2 and zones versus divisions. Carbon monoxide adds a second layer. Steel plants restrict work in any area above 50 ppm CO without breathing protection.
Hot work on a charged COG line is limited (one plant standard caps welding current at 100 A), and an ignition-free radius is enforced around open lines. Plan the installation, including the hot tap, around those rules rather than around the meter datasheet.
Selecting the meter
Start from the tap, not the technology. Pressure and dirt at the tap decide the shortlist, and area classification trims it. The purpose of the number, whether allocation, control or energy balance, decides how much compensation and analysis to add around it.
| Situation | First choice and why |
|---|---|
| Clean gas, DN300 to DN1500, cannot shut down | Insertion ultrasonic through hot-tap valves; add pressure and temperature transmitters and compute Nm³ in the flow computer. |
| Booster discharge, allocation between departments | Ultrasonic gas spool with certified electronics; sound speed set from the site analysis and checked against the diagnostic readout. |
| Dirty gas near the by-product plant, DP acceptable | V-cone or wedge with purged impulse lines and a remote-mounted DP transmitter. |
| Large low-pressure main, pressure loss must stay under 1 kPa | Averaging pitot tube with nitrogen purge; accept the plugging maintenance. |
| Hot or mixed gas line above 150 °C | DP element or a high-temperature gas flow meter probe, transmitter remote; live composition if the blend varies. |
| Fixed-composition branch, small bore | Thermal mass, factored for the analyzed gas; or a vortex flow meter if the gas is clean and the velocity stays above its minimum. |
Straight run is the usual 10D upstream and 5D downstream for spool meters, and less for insertion ultrasonics with path correction. The general rules are in our flow meter straight run guide. For a quote, send five things: the latest gas analysis with its sampling point, pressure and temperature at the tap, pipe size and wall material, the area classification at the tap, and what the number is for.
The same approach applies to natural gas flow meters when a plant runs mixed gas. The level-side companion to this page is our guide to blast furnace level measurement.
FAQ
Which flow meter is best for coke oven gas?
For clean gas headers, a transit-time ultrasonic meter, either an insertion type that can be withdrawn for cleaning or a spool at the booster discharge. Near the by-product plant, where naphthalene still crystallizes, a V-cone or wedge with purged impulse lines is the more durable differential pressure choice. Thermal mass only fits fixed-composition branches.
What percentage of coke oven gas is carbon monoxide?
About 5 to 7 percent by volume in clean gas, with published plant ranges of 4.5 to 7.5 percent. That is enough to make any leak dangerous: steel plants restrict work in areas above 50 ppm CO without breathing protection, so a metering point is planned with CO detection and gas-free procedures for the hot tap.
What is the lower explosive limit of coke oven gas?
About 4.4 percent in air for clean gas, with an upper limit of about 34 percent. The wide range comes from the 55 to 62 percent hydrogen, which is also why the gas is classed as Group IIC (IEC) or Group B (North America) for equipment selection.
What are the common problems with gas flow meters?
On coke oven gas the four recurring ones are naphthalene and tar fouling of wetted parts, line pressure too low for an orifice plate, thermal mass calibration drifting as the composition changes, and an ultrasonic meter configured with the wrong sound speed for a hydrogen-rich gas. Each has a specific fix in the sections above.
Request a quote
Tell us where the tap is, the gas analysis, the pressure and temperature there and the area classification. We will recommend a meter and the compensation around it, not a shelf part. Reach our application engineers or use the form below.
Written and technically reviewed by Wu Peng and the Instranova engineering team.