By Wu Peng, Senior Process Instrumentation Engineer · Last reviewed October 21, 2026
A tank strapping chart is a table that converts a measured liquid level into the volume in that particular tank, row by row. It is also called a strapping table, tank calibration chart, gauge chart, dip chart or dipstick chart. You read the level from the datum at the bottom, find that row, and read off gallons, barrels or liters.
Every chart belongs to one tank. Two tanks with the same nameplate capacity can hold different volumes at the same reading, because shells are rarely perfectly round, bottoms are seldom flat and fittings take up space. A chart calculated from drawings is a theoretical chart. A chart computed from measurements of the built tank, with its corrections, is the one used when the volume is sold.
Contents
- What the chart shows
- Strapping chart generator
- Formulas behind it
- Worked example
- Reading the chart
- How tanks get strapped
- Chart corrections
- Loading it into instruments
- When to restrap
- FAQ
What the chart shows
The name comes from the steel tape, or strap, that surveyors wrap around a tank shell to measure its circumference. Those circumferences, taken course by course (one ring of shell plates at a time), become diameters, and the diameters become volumes. On an oil lease the phrase has a second, everyday meaning: strapping a tank also means gauging it by hand, dropping a weighted tape to the bottom and reading the oil mark.
A chart has two columns at minimum, level and volume. The level is an innage, the depth of liquid measured up from the datum plate, a steel plate on the floor below the gauge hatch. Charts for tank trailers, rail tank cars and ship tanks may instead be written as outage (also called ullage), the empty space measured down from a reference point.
Rail tank car gauge tables, for example, list outage in 1/4 inch steps. Our tank gauging guide explains innage, outage and reference height in detail.
The level step is the increment. Chart generators for shop-built tanks offer steps from 1 inch down to 1/8 inch, and metric charts commonly step by 1 cm. The step should match how finely the tank is gauged.
In the United States, manual gauging of an underground storage tank (UST) needs equipment that reads to the nearest 1/8 inch under 40 CFR 280.43 of the Code of Federal Regulations. On federal onshore oil leases, 43 CFR 3174.6 averages repeated hand gauges to the nearest 1/4 inch on tanks of 1,000 barrels or less. Above that size the rounding is 1/8 inch.
Volume is not linear with level unless the walls are vertical. In a horizontal cylinder the first inch at the bottom holds a sliver of liquid, while an inch at mid-height holds the full width of the tank. That curve is why a horizontal tank needs a chart.
Strapping chart generator
Enter the inside dimensions, pick an increment and the generator writes the chart. Use inside dimensions: on a 1/4 inch shell, outside measurements overstate a 96 inch tank by about 1 percent. The CSV download opens in Excel. The linearization option returns a short point list for a level transmitter, recorder or programmable logic controller (PLC) instead of a full table.
Tank strapping chart generator
in
in
in
in
Theoretical chart from geometry only: no deadwood, bottom shape, tilt, shell stretch or temperature correction. Heads are treated as elliptical: enter the radius as the head depth for a hemispherical head, or a quarter of the diameter for a 2:1 elliptical head. Dimensions entered in feet are converted to inches, and chart levels are in inches or centimeters. 1 bbl = 42 US gal; 1 US gal = 231 in³ = 3.785 L.
Formulas behind it
For a horizontal cylinder of inside radius R and shell length L, filled to depth h, the volume in the shell is the area of a circular segment times the length.
Vshell = L × [R² × acos((R − h) / R) − (R − h) × √(2Rh − h²)]
Each head adds volume. Two elliptical heads of depth a together fill like one ellipsoid:
Vheads = π × a × h² × (3R − h) / (3R)
When the tank is full (h = 2R), the heads hold (4/3) × π × R² × a.
A flanged and dished (torispherical) head of the same depth holds less. By our numerical integration, the gap is about 9 percent for a crown radius equal to the diameter with a 6 percent knuckle, and about 7 percent for an 80:10 head. Treat the head term as an approximation for those heads.
Vertical and rectangular tanks are simpler: V = π × R² × h for a flat-bottom vertical cylinder and V = W × L × h for a flat-bottom box. Both are straight lines. Their charts only become nonlinear through the real-world corrections below: a cone or dish in the bottom, deadwood and shell stretch. Convert cubic inches to US gallons by dividing by 231, and gallons to barrels by dividing by 42.
Worked example
Take a horizontal fuel tank, 96 inches inside diameter (8 ft) with a 360 inch (30 ft) shell and flat ends. R = 48 inches.
- Full volume = π × 48² × 360 / 231 = 11,280.4 gal, which is 268.6 bbl
- At h = 24 in (one quarter of the diameter): segment area = 2,304 × acos(0.5) − 24 × √1,728 = 1,415.08 in²
- Volume at 24 in: V = 1,415.08 × 360 / 231 = 2,205.3 gal
- At h = 48 in: exactly half, 5,640.2 gal
- At h = 72 in: 9,075.0 gal; the empty space above it mirrors the liquid at 24 in
A quarter of the depth holds only 19.6 percent of the tank, and three quarters of the depth holds 80.4 percent. Run the generator with the default inputs and these values appear in the 24, 48 and 72 inch rows.
If the same tank had 2:1 elliptical heads, each 24 inches deep, the heads would add 1,002.7 gal at full, for 12,283.1 gal in total. Set the head depth to 24 in the generator to see the whole table shift.
As a cross-check, the generator reproduces Greer Tank’s published chart for a 45.5 by 71 inch, 500 gallon flat-end tank. All 12 rows we compared, from 1 to 31 inches, agree within 1 gallon.
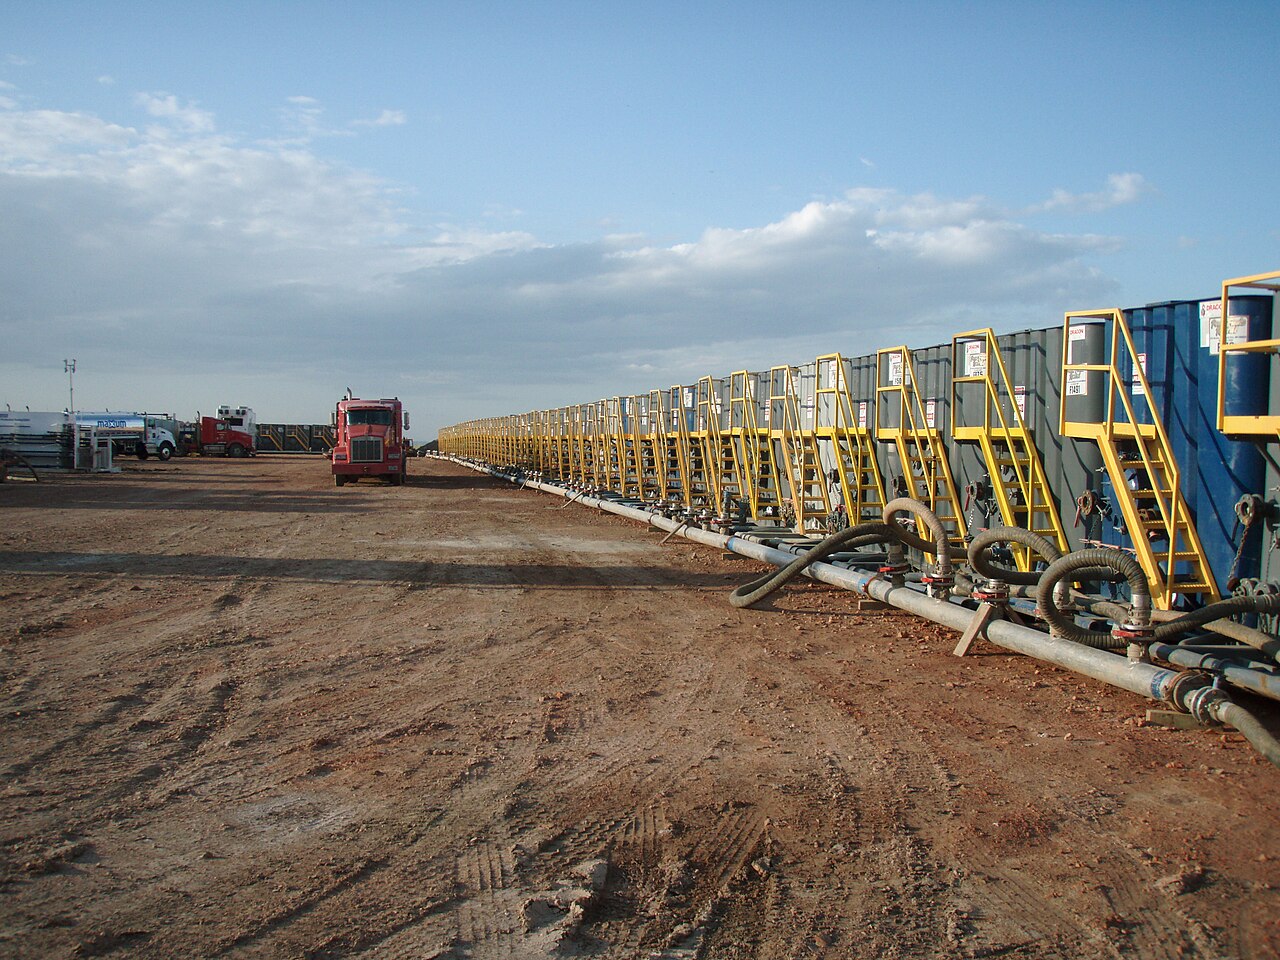
Reading the chart
- Check what the chart is based on: innage or outage, the level and volume units, and the reference height printed on it.
- Lower the tape from the marked reference point at the hatch, and repeat until the readings agree.
- If the chart is an innage chart but you measured outage, or a radar gauge reports ullage, convert first: innage = reference height − outage.
- Find the two rows that bracket the reading and interpolate between them.
- Record the result as an observed volume. Free water, temperature and sediment corrections come after the chart.
Reading between rows. The gauge tape reads 30 3/8 inches on a 1 inch chart, where the 30 inch row is 3,011.7 gal and the 31 inch row is 3,151.0 gal, a difference of 139.3 gal. Interpolate linearly: 3,011.7 + 0.375 × 139.3 = 3,063.9 gal. The exact geometric value is 3,063.8 gal, so straight-line interpolation over a 1 inch step costs about 0.1 gal here.
Resolution is the other check. Near mid-height this tank holds 149.6 gal per inch, so 1/8 inch is worth about 18.7 gal. The first inch at the bottom holds only 20.3 gal. A gauge that reads to 1/8 inch therefore sees small volumes clearly near the bottom and coarsely near the middle, whatever the chart increment.
How tanks get strapped
Charts used for custody transfer, where the measured volume is the basis of a sale, come from measuring the tank after it is built, usually by a third-party calibration company, not from nameplate geometry. The American Petroleum Institute covers the methods in Chapter 2 of its Manual of Petroleum Measurement Standards (API MPMS); several sections are also ISO standards.
| API MPMS | Method and scope |
|---|---|
| 2.2A | Manual tank strapping of upright cylindrical tanks with a steel tape; 2nd edition, November 2019 |
| 2.2B | Optical reference line method (ORLM), an alternative way to get upright tank diameters |
| 2.2C | Optical triangulation with theodolites, precision angle-measuring instruments (ISO 7507-3) |
| 2.2D | Internal electro-optical distance ranging (EODR) for upright tanks over 5 m (16 ft) in diameter (ISO 7507-4) |
| 2.2E | Manual methods for horizontal tanks up to 4 m (13 ft) in diameter and 30 m (100 ft) long, tilt up to 10 percent with a correction (ISO 12917-1) |
| 2.2F | Internal EODR for horizontal tanks over 2 m (6 ft) in diameter (ISO 12917-2) |
| 2.2G | Total station (electronic theodolite with distance meter) reference line method for upright tank diameters; dented or visibly damaged tanks are excluded |
| Std 2555 | Liquid calibration: metered quantities of liquid are added or withdrawn and the level recorded |
Titles, editions and scopes from the API 2024 Petroleum Measurement catalog.
In manual strapping, a crew wraps the tape around each shell course, corrects it for tape temperature and tension, and records the plate thicknesses. Calibration company AmSpec describes taking these girths at about 20 and 80 percent of each ring height. The optical and laser methods measure the same shell without a tape; Intertek, for example, describes its EODR and laser scanning as quicker and safer, with measurements taken from ground level.
Liquid calibration works the other way round. A known volume goes in through a calibrated meter, and the level is read after each step. It suits small, odd-shaped or internally cluttered vessels, where a geometric calculation would miss too much.
Chart corrections
A measured chart is geometry plus corrections. OIML R 71:2008 is the International Organization of Legal Metrology recommendation for fixed storage tanks. It sets the maximum permissible calibration uncertainty at 0.2 percent of the indicated volume for vertical cylindrical tanks, 0.3 percent for horizontal or tilted cylinders and 0.5 percent for other tanks.
Emerson’s engineer’s guide to tank gauging notes that older calibration methods often state 0.10 percent table uncertainty, and EODR-based calibrations as low as 0.01 to 0.02 percent. A calibration has to account for the items below to reach numbers like these.
- Deadwood. Fittings, structure and piping that change the tank’s capacity. Internal columns, heating coils and ladders displace liquid and are subtracted at the heights where they sit; external clean-out boxes and sumps add capacity.
- Bottom survey. A coned or sloped floor makes the first few inches or centimeters nonlinear. Surveyors read the floor elevation at set intervals, typically with a laser level set up in the center of the tank.
- Tilt. A horizontal tank that leans changes every row of the chart. API 2.2E applies a tilt correction for slopes up to 10 percent.
- Shell temperature and liquid head. A steel shell grows when it is warmer than the chart’s calibration temperature and bulges slightly under the head of liquid. Emerson’s guide uses 0.000022 per °C for a carbon steel shell, so a shell 20 °C (36 °F) warmer holds about 0.044 percent more. ISO 7507-1 carries annexes on both effects.
- Floating roof. Once the roof floats it displaces liquid equal to its weight, so the roof correction depends on product density. The band where the roof is lifting off its legs, the critical zone, is marked on the chart. Calibration company AmSpec, citing API MPMS 2.2A, advises keeping custody transfers from starting or ending in it.
- Incrustation. Scale or wax on the walls reduces capacity; API RP 2556 covers correcting gauge tables for it.
Loading it into instruments
A level transmitter measures height. Volume comes from the chart, held in the gauge electronics, a recorder, a PLC or tank inventory software. Radar and servo gauges measure down from the roof nozzle, an outage, while hydrostatic and magnetostrictive sensors measure up from near the bottom, an innage. Our level transmitter types guide compares the technologies.
Match the zeros first. The chart’s zero is the datum plate; the transmitter’s zero is wherever its probe tip, diaphragm or flange reference sits. An October 2024 OIML Bulletin paper on linking automatic level gauges to calibration tables states that, for atmospheric tanks, the table zero is aligned with the dipping datum point. Check it with a hand dip, then enter the offset.
How much a zero error costs depends on the tank. On a 30 ft (9.1 m) diameter vertical tank every inch holds 440.6 gal (10.5 bbl), so a 1/4 inch zero offset shifts every reading by about 110 gal.
Next comes the table. A gauge, recorder or PLC function block that holds a table stores level and volume pairs and interpolates straight lines between them; Rockwell’s PlantPAx strapping table instruction, for example, interpolates linearly. Where the device limits the number of pairs, point placement matters. For the 96 inch by 30 ft tank in the example, we computed the worst-case error of each point count against the exact curve:
| Points in the table | Worst error, % of full |
|---|---|
| 2 (straight 4‑20 mA scaling) | 5.8 % (651 gal) |
| 11, evenly spaced | 0.74 % (84 gal) |
| 21, evenly spaced | 0.27 % (31 gal) |
| 21, closer at bottom and top | 0.10 % (11 gal) |
Computed on a 0.01 inch grid against the exact segment formula; flat ends.
The evenly spaced tables miss worst near the bottom and top, where the curve bends hardest. Moving the same 21 points toward the ends cuts the error by about two thirds, which is how the generator’s linearization option places them. Ask what point count the receiving device accepts before you build the list.
Application example
Diesel storage, Central America. A diesel tank inquiry was quoted as one level, volume and flow package: a submersible level sensor, a recorder that displays the tank’s volume and a flow meter. In a package like this the sensor only supplies a level, and the volume display is only as good as the tank table loaded into the recorder. That is why the tank drawing or its existing strapping chart belongs in the quote request.
For diesel, a hydrostatic sensor also needs the fuel’s density, which our diesel tank level gauge guide works through. Level instruments that suit a tank with a strapping chart include a radar level sensor for oil tanks, a magnetostrictive level transmitter or hydrostatic level sensors, and a paperless recorder can log the result.
For a single volume rather than a whole table, use the horizontal tank volume calculator or the tank volume calculator for vertical and rectangular tanks.
When to restrap
There is no single legal interval. OIML R 71 leaves the frequency to national authorities and requires recalibration when deformation changes the tank’s capacity. Calibration companies AmSpec and HMT both cite a 15-year recalibration interval; AmSpec applies it to tanks in custody transfer service and attributes it to Appendix A of API MPMS 2.2A. AmSpec also cites a suggested five-year check of the bottom course diameter, plate thickness and tilt.
Table accuracy is also a regulatory topic. After the 2003 breakout tank explosion and fire at Glenpool, Oklahoma, the National Transportation Safety Board (NTSB) issued recommendation P-04-08. It called for an advisory telling liquid pipeline operators to validate their tank strapping tables. The Pipeline and Hazardous Materials Safety Administration (PHMSA) issued it in 2005 as Advisory Bulletin ADB-05-02.
Whatever the interval, restrap or recompute the chart when:
- the tank is new, moved or taken apart and re-erected
- the floor, shell or deadwood is changed, often after a repair under API 653, the tank inspection and repair standard
- the product density changes enough to move the floating roof correction
- the reference height measured at the gauge hatch no longer matches the chart
The last item is the cheapest to catch. Measure the reference height with the dip tape whenever you check a level instrument against a hand gauge, and write it next to the reading.
FAQ
What is tank strapping?
Tank strapping is measuring a tank so that a chart of level against volume can be computed for it. The name comes from the steel tape, the strap, wrapped around the shell to measure its circumference. In the oil field the same words also mean gauging a tank by hand with a weighted tape.
How is tank strapping done?
For upright tanks, a crew measures the circumference of each shell course with a steel tape under API MPMS 2.2A, or measures the shell optically or with a laser under 2.2B, 2.2C, 2.2D or 2.2G. They also measure plate thickness, survey the bottom, check tilt and record deadwood, then compute the volume table. Small or irregular tanks can instead be calibrated by metering liquid in.
What is deadwood in tank calibration?
Deadwood is any fitting, structure or piping that changes a tank’s capacity. Internal columns, coils and ladders displace liquid and reduce the volume at their heights; external sumps or clean-out boxes add to it. The calibration chart includes these corrections, so changing deadwood means recomputing the chart.
Request a quote
If you are adding a level transmitter to a tank with a strapping chart, send us the tank drawing or chart, the product and its density range, the nozzle available for the instrument and the output you need. Tell us the application and we configure one unit, not a shelf part. Reach our application engineers or use the form below.
Written and technically reviewed by Wu Peng and the Instranova engineering team.