By Wu Peng, Senior Process Instrumentation Engineer · Last reviewed August 18, 2026
River water level, called stage or gauge height, is the height of the water surface above a fixed reference elevation called the gauge datum. For a spot reading, a staff gauge bolted to a pier or bank is read by eye. Continuous river water level measurement uses a radar sensor above the surface, a submersible pressure transmitter on the bed, a bubbler line, or a float in a stilling well. The reading is logged every few minutes and transmitted over RS-485, 4-20 mA or a cellular link.
The method decides what the station costs to maintain. The USGS operates more than 11,300 streamgages and holds stage records to 0.01 ft (3 mm) or 0.2 percent of stage. A flood-warning site that loses its sensor in the first major event records nothing.
This guide compares the methods with real accuracy numbers and works the datum arithmetic. It also covers two points most published guides skip: where exactly to mount a radar, and how to power the station.
Contents
- Stage, depth and datum
- Measurement methods compared
- Radar water level sensors
- Submersible pressure sensors
- Bubblers and stilling wells
- Station design and power
- Flood alarm setpoints
- From level to flow
- FAQ
Stage, depth and datum
Stage and depth are different numbers, and mixing them up causes real procurement mistakes. Stage is measured up from the gauge datum, a fixed elevation set below the lowest level anyone expects to record, so readings stay positive. Depth is the distance from the surface down to the bed.
Depth changes across the channel and after every flood that moves sediment; stage does not depend on the bed at all. A gauge reading of 2.0 m does not mean the river is 2.0 m deep.
The gauge datum is tied to a national vertical datum, in the United States NAVD 88 (older stations still reference NGVD 29). The conversion is one addition. If the gauge zero sits at an elevation of 210.00 ft NAVD 88 and the gauge reads 6.42 ft, the water surface elevation is 216.42 ft NAVD 88.
That elevation is the number engineers compare against levee crests, bridge soffits and floodplain maps. The raw stage value means nothing outside its own station. That is why every sensor in the sections below is surveyed to the datum once at installation.
Measurement methods compared
Six methods cover almost every river, reservoir and open channel station. Published guides list them; almost none puts their accuracy side by side. The table gives representative numbers so the trade can be seen at a glance. Confirm each value against the datasheet of the specific instrument being bought.
| Method | Typical accuracy | Range | Notes |
|---|---|---|---|
| Staff gauge | About 1 cm by eye in calm water | Board length | Manual spot readings; the reference every automatic sensor is checked against |
| Radar (76-81 GHz) | ±1 to 3 mm | 0.05 to 60 m, models to 120 m | Non-contact; nothing in the water to foul, freeze or wash away |
| Ultrasonic | ±0.2 to 0.5% of range (±30 mm at 15 m) | To 15-40 m, blind zone 0.6-1.5 m | Non-contact, lower cost; needs temperature compensation |
| Submersible pressure | ±0.1 to 0.5% of span (±10 to 50 mm at 10 m) | To 200 m and beyond | Contact; vented cable required; density and sediment affect the reading |
| Bubbler | 0.01 ft class with a good controller | Tens of meters | Only an orifice line in the water; self-purging on silty beds |
| Float in stilling well | 0.01 ft (3 mm) class | Well height | The classic USGS method; needs a well structure and sediment cleanout |
Representative values at reference conditions; confirm per datasheet. Accuracy figures for non-contact devices are distance-to-surface accuracy.
For calibration reference, the USGS accepts stage instrumentation that resolves 0.01 ft (3 mm) or 0.2 percent of the effective stage, whichever is less restrictive. Radar, bubblers, floats and vented pressure sensors can all reach that class when sized correctly. The differences that decide the purchase are maintenance and survivability, not headline accuracy.
Radar water level sensors
Radar has become the default for new river stations, and the reasons are practical. Nothing touches the water, so floating debris, sediment, ice and corrosion never reach the instrument.
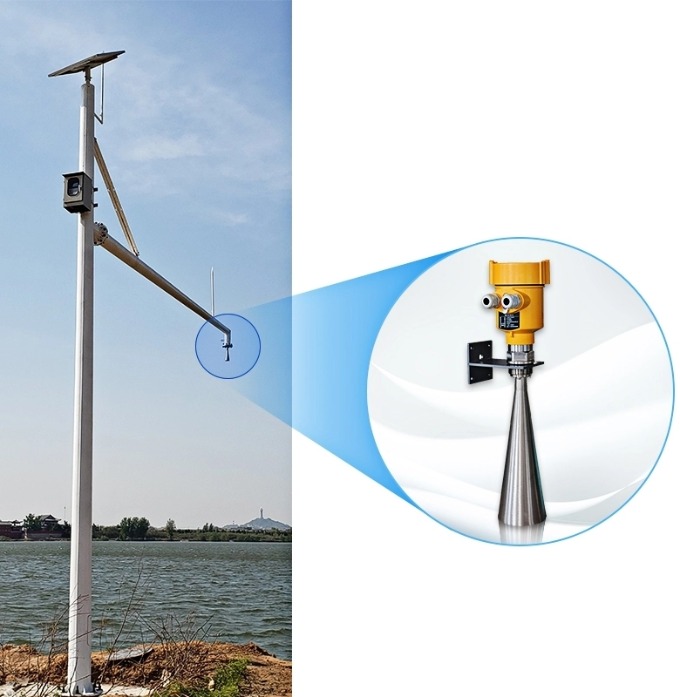
An 80 GHz radar water level sensor with a lens antenna reads the surface to about ±1 mm over ranges of 0.05 to 60 m. It runs on two-wire 24 VDC or a battery system and reports over RS-485 Modbus or 4-20 mA. Pulse radar models draw under 0.5 W, which is what makes solar stations workable.
Mounting geometry is where radar installations go wrong, and it is simple arithmetic. The beam spreads as a cone, and the footprint on the water is 2H multiplied by tan(θ/2), where H is the height above the surface and θ is the beam angle.
| Height above low water | Footprint, 6° beam | Footprint, 10° beam |
|---|---|---|
| 5 m | 0.52 m | 0.87 m |
| 10 m | 1.05 m | 1.75 m |
| 20 m | 2.10 m | 3.50 m |
Footprint diameter = 2H tan(θ/2). The whole footprint must land on water at the lowest expected stage.
Three siting rules follow from that table. Keep the full footprint clear of banks, pilings and moored structures at low water. A bank return is a stronger echo than a calm surface.
Mount the antenna above the highest flood level you design for. Leave enough margin that the peak stage never enters the blanking distance near the antenna, typically the first 0.05 to 0.5 m.
And aim at moving representative water, not at the still eddy behind a pier. For narrow structures a 76-81 GHz unit with a lens antenna and a 3 to 6 degree beam is easier to site than a 26 GHz horn. The 80 GHz FMCW radar transmitter series and the wider radar level sensor range cover both cases.
Where cost dominates and the range is under about 15 m, an ultrasonic level transmitter does the same job. Expect wider error bands and a blind zone to respect.
Ultrasonic also depends on the speed of sound in air, which runs about 331 m/s at 0 °C and 343 m/s at 20 °C, so an uncompensated instrument drifts roughly 3.5 percent over a 20 degree swing. Built-in temperature compensation is standard for that reason, and it corrects the air column at the sensor, not a thermal gradient between sensor and water.
Submersible pressure sensors
A submersible sensor sits on the bed, or hangs in a protective pipe, and measures the water column above it as hydrostatic pressure. P = ρgh, so 5 m of fresh water reads about 48.9 kPa.
A vented cable references the cell to atmosphere, which is not optional. A sealed absolute sensor absorbs weather swings of ±3 kPa as a false ±0.31 m of level. That is an order of magnitude more than the sensor itself contributes.
Density is the second correction. A submersible pressure transducer is calibrated for clean water near 998 kg/m³. In flood flow carrying heavy suspended sediment the mixture density can reach 1050 kg/m³.
Five meters of that water then reads as 5.26 m, 5.2 percent high, exactly when the number matters most. Radar is unaffected by density; that alone justifies it on sediment-heavy rivers.
A pressure sensor is still the right choice over long ranges, under ice, or inside a protective conduit on a reservoir wall. There, run the cable in grounded conduit for lightning exposure and anchor the probe so it cannot shift downstream. The hydrostatic level sensor line covers rod, cage and deep-water builds. In boreholes the same transducer follows different rules, worked through in our well water level measurement guide.
Bubblers and stilling wells
A bubbler pushes a small constant flow of air or nitrogen down a tube to an orifice fixed underwater. The pressure needed to push bubbles out equals the head of water over the orifice. The transducer and all the electronics stay dry on the bank.
Because gas is always flowing outward, the line clears its own silt, which is why bubblers survive on sand-bed rivers that bury submersible probes. The cost is a compressor or gas bottle and periodic orifice checks. The purge-rate and tubing-friction math is worked through in our bubbler level measurement guide.
The stilling well is the oldest continuous method and still one of the most accurate. A vertical well on the bank connects to the river through intake pipes. Inside, a float on a tape drives a shaft encoder, reading to the 0.01 ft class while waves and turbulence stay outside.
That costs civil work and maintenance, since intakes silt up and wells need flushing. We covered sizing, intake rules and the anti-surge details in the stilling well design guide. On new solar-powered sites radar has largely displaced both methods. On an existing well structure, though, a float encoder or a down-looking radar inside the well reuses the civil work already paid for.
Station design and power
A water level monitoring station is a system: sensor, logger or RTU, telemetry, power. Most remote sites transmit over 4G or NB-IoT with a fallback interval log, and the electrical design starts from one number, the average power draw.
A station averaging 1 W consumes 24 Wh per day. A 30 W solar panel at four peak sun hours with a 0.7 system derating delivers about 84 Wh per day. That is three and a half times the load.
Batteries sized for five dark days need 120 Wh, roughly 10 Ah at 12 V. Doubling that for depth-of-discharge margin means a 20 Ah battery.
Those numbers are why sensor wattage is a selection criterion, not a footnote. A pulse radar under 0.5 W halves the whole power chain compared with a 1 W continuous-wave unit.
Application example
Hydrology stations, East Africa. A stormwater management program needed both velocity and level at open-channel hydrology stations, with everything non-contact. The specification paired a radar velocity meter (0.1 to 25 m/s, ±0.01 m/s) with a 35 m radar level transmitter carrying a 76 mm lens antenna. Instranova quoted the integrated velocity-plus-level pair for the stations, keeping both instruments above the surface.
Flood alarm setpoints
If the station protects anything downstream, the alarm levels need as much thought as the sensor. In the United States the National Weather Service sets a flood stage for each forecast point and defines four categories around it, and they map cleanly onto alarm setpoints.
| NWS category | Meaning | Recommended station response |
|---|---|---|
| Action stage | Elevated water; mitigation preparation begins | First alarm; shorten the logging and reporting interval |
| Minor flood | Minimal property damage, possible public threat | Notify operations; verify against the staff gauge if access allows |
| Moderate flood | Some inundation of structures and roads | Escalation to emergency contacts |
| Major flood | Extensive inundation, significant evacuations | Everything above, and the sensor must still be above the water |
Categories per the National Weather Service; stage values for each category are set per forecast point, not nationally.
Two design rules follow. Mount the sensor and the electronics above major-flood elevation plus freeboard. An instrument that floods at moderate stage cannot report the major stage that follows. And make the highest alarm independent of the level transmitter where consequences are serious, the same one-sensor-one-job logic used for tank overfill protection.
From level to flow
Level is often only half the requirement; the question behind it is discharge, how much water is passing. Stage converts to flow through a rating curve, a site-specific relation built by measuring discharge across the range of stages and fitting stage against it.
Agencies maintain those curves continuously because the channel does not stay still. Weed growth in summer, ice in winter and shifted gravel after floods all move the relation. That is why a stage sensor alone is never a flow meter.
Where a project needs flow without years of rating measurements, pair the level sensor with a velocity measurement, the arrangement in the East Africa stations above. And keep the vocabulary straight when specifying. Bathymetric survey work measures depth to the bed, a job for a portable ultrasonic water depth gauge rather than a level station.
FAQ
How to measure water level in a river?
Read a staff gauge by eye for spot values, or install a continuous sensor referenced to the gauge datum: radar looking down at the surface, a submersible pressure transmitter on the bed, a bubbler orifice line, or a float in a stilling well. Radar is the usual choice for new stations because nothing touches the water.
How do I check my local river level?
In the United States, the USGS National Water Dashboard and the National Weather Service water prediction site publish live stage and flood-category data for thousands of public gauges. Many state and municipal agencies publish their own portals. For a private intake, reservoir or plant outfall, you install your own station; public gauges rarely sit where your asset is.
How to check the depth of a river?
Depth is measured from the surface down to the bed, so it is a different measurement from stage. For spot depths use a sounding weight or a portable ultrasonic depth gauge; for a full cross-section, echo-sounding survey work. A level station cannot give depth unless the bed elevation at that point is surveyed and stable.
Is there a USGS river gauge app?
The USGS National Water Dashboard is a mobile-friendly web application showing real-time stage and flow from the national streamgage network. The USGS WaterAlert service sends notifications when a gauge you follow crosses a threshold you set. Both are free and cover more than 11,300 streamgages.
Request a quote
Tell us the application and we configure one system, not a shelf part. Send the range from lowest to highest expected stage, the mounting structure available, power at the site, the output or telemetry you need, and whether the water carries sediment or debris. Reach our application engineers or use the form below.
Written and technically reviewed by Wu Peng and the Instranova engineering team.