By Wu Peng, Senior Process Instrumentation Engineer · Last reviewed August 12, 2026
Turndown ratio is the span between the largest and smallest flow a meter can measure while still meeting its stated accuracy, written as a ratio: TR = Qmax / Qmin. A meter with a 10:1 turndown that tops out at 100 m³/h holds its specification down to 10 m³/h. The same word also describes boiler burners, control valves, and pumps. This guide covers flow meters and pressure transmitters, where the term is often used interchangeably with rangeability.
The number on the datasheet is only half the story. What matters is how accuracy behaves across that span, and the arithmetic connecting the two is short enough to do on a napkin. This guide works through it: what the ratio means, how the accuracy statement changes everything, and typical turndown by technology with the reasons behind the numbers. It then covers the square-root effect that pins differential pressure meters near 4:1, and how transmitter turndown differs from meter turndown.
Contents
- What turndown means
- Turndown and accuracy
- Turndown by technology
- The square-root penalty
- Transmitter turndown
- Sizing for turndown
- Related guides and tools
- FAQ
- Request a quote
What turndown means
Divide the maximum measurable flow by the minimum measurable flow, both taken at the point where the meter still meets its accuracy statement:
Turndown ratio = Qmax / Qmin
A gas line swinging between 100,000 and 1,000,000 m³ per day needs a meter with a turndown of at least 1,000,000 / 100,000 = 10:1.
The definition hides one trap: Qmin is not the smallest flow that produces a reading. Most meters keep producing numbers well below their accuracy floor; the numbers just stop meaning anything. Turndown counts only the range where the specification holds, which is why the accuracy statement, covered next, decides how useful a given ratio really is.
Turndown and accuracy
Accuracy specifications come in two currencies, and turndown is where the difference gets expensive. A percent-of-reading specification stays proportional as flow falls. A percent-of-full-scale specification is a fixed absolute error. As the flow drops, that fixed error becomes a growing share of what you are measuring:
Error as percent of reading = spec (%FS) × Qmax / Q
| Operating point | Meter specified ±1% FS | Meter specified ±1% of reading |
|---|---|---|
| Full flow | ±1% of reading | ±1% of reading |
| 25% flow (4:1) | ±4% of reading | ±1% of reading |
| 10% flow (10:1) | ±10% of reading | ±1% of reading |
Percent-of-reading specifications usually carry a zero-stability or low-flow term that takes over at the bottom of the range; read the full accuracy equation, not the headline number.
This is why a wide turndown claim paired with a percent-of-full-scale specification can be worth less than a narrow claim paired with percent of reading. Published Coriolis data makes the point at the high end. One widely quoted specification holds ±0.05% of reading out to 20:1, degrades to ±0.25% at 100:1, and reaches ±1.25% at 500:1. The meter keeps working across the whole span; what changes is how much each reading is worth.
Turndown by technology
Published turndown figures for the same technology vary from one source to the next. Part of the spread comes from vendors quoting different accuracy bases, and part from lists copied without them. The ranges below are typical for industrial designs, with the physical reason each technology lands where it does.
| Technology | Typical turndown | What sets the floor |
|---|---|---|
| Orifice plate with DP transmitter | 3:1 to 5:1 typical; up to about 10:1 with a high-performance transmitter and careful ranging | The square-root penalty below; the DP signal collapses far faster than the flow. |
| Variable area (rotameter) | 10:1, some designs 20:1 | Float position resolution and scale length. |
| Positive displacement | 5:1 to 10:1, wider as viscosity rises | Slippage past the rotors at low flow; thick fluids seal better, so the range grows. |
| Turbine | 10:1 to 20:1 | Bearing drag and K-factor linearity at the low end of the rotor’s range. |
| Vortex | About 20:1 on clean, low-viscosity service | The low-flow cutoff where vortex shedding weakens; viscosity shrinks the range from the bottom. |
| Magnetic | 40:1 to 100:1 | Zero stability at low velocity; the electrode signal shrinks with the flow. |
| Ultrasonic transit-time | 50:1 to 100:1 | Timing resolution at low velocity; claims above this need the accuracy basis checked. |
| Coriolis | 100:1 usable | Zero stability; accuracy degrades progressively rather than stopping, as the figures above show. |
| Thermal mass | 100:1 typical, up to 1000:1 by range | Velocity spans of 0.1 to 100 Nm/s are common in gas service; verify accuracy at the bottom decade. |
Ranges are for typical industrial designs; the datasheet for a specific size and model governs. Both ends move with fluid properties, especially viscosity.
Two cross-checks tie these numbers back to the physics. First, a falling flow rate also lowers the Reynolds number, and a meter can lose its regime before it loses its signal. The Reynolds number calculator shows where the bottom of your range lands.
Second, any claim far outside these bands usually turns out to be quoted against a relaxed accuracy basis. That is a fair engineering trade as long as it is a visible one.
The square-root penalty
Differential pressure meters read low turndown for a structural reason. The pressure drop across an orifice grows with the square of flow, so the signal range is the square of the flow range:
DP / DPmax = (Q / Qmax)²
At 10% flow the differential is (0.10)² = 1% of span. A 10:1 flow turndown demands a 100:1 DP turndown from the transmitter.
Follow the error through. A DP transmitter uncertainty of ±0.1% of span is invisible at full flow. At 25% flow the differential is 6.25% of span, so that same ±0.1% is 1.6% of the signal, and after the square root it leaves about ±0.8% on flow. At 10% flow the differential is 1% of span, the uncertainty is 10% of the signal, and the flow error is about ±5%.
That staircase is why orifice systems are quoted at 3:1 to 5:1 while the same transmitter measuring static pressure covers 100:1. The mathematics of the square-root relationship is covered in our DP flow calculation guide. The transmitter side of it lives in our square-root extraction calculator.
Transmitter turndown
Transmitter datasheets use the same word for a different quantity, and mixing the two causes real selection mistakes. For a pressure or DP transmitter, turndown is a re-ranging ratio:
Transmitter turndown = URL / minimum calibrated span
where URL is the upper range limit of the sensor. A transmitter with a 1,000 kPa URL and a 40:1 turndown can be ranged down to a 25 kPa span. A 100:1 model goes to a 10 kPa span.
This is flexibility in configuration: one sensor body covering many possible calibrated ranges. It says nothing by itself about how far one flow measurement can swing, which is the meter turndown discussed above.
Re-ranging deep also carries its own accuracy cost. Specification terms quoted as a percentage of URL, such as static pressure and temperature effects, stay constant in absolute terms when you shrink the span. As a share of what you measure, they grow in proportion to the turndown.
Setting a 100:1-capable transmitter to its minimum span is legitimate. The achievable accuracy at that setting comes from the full error equation, not from the reference line. The same logic drives calibration decisions, covered in our pressure transmitter calibration guide.
On the vocabulary: most instrument vendors use rangeability and turndown as synonyms, and this guide does the same. In the control valve world the two are defined differently, with turndown tied to the installed operating range and rangeability to the bench characteristic. A valve datasheet quoting both is therefore not repeating itself. Knowing which world a document comes from resolves most of the apparent contradictions between sources.
Sizing for turndown
The working procedure has three steps. First, establish the real flow range. The maximum must include peaks; the minimum must include night setback, seasonal lows, startup, and any batch tail you still need to see. Second, divide them to get the required turndown.
Third, compare against the technology table with the accuracy basis in hand. Then check that the low end of the range still clears the physics: the Reynolds band, a vortex low-flow cutoff, or a DP signal too small to trust.
Oversizing is the classic way to lose turndown without noticing. A meter sized for a flow that never arrives spends its life in the bottom of its range, where a percent-of-full-scale specification is at its worst. Sizing the meter for the real operating window, not the pipe diameter, recovers more measurement quality than any upgrade in specification grade.
When one technology cannot cover the span, move up the table to a wider-turndown technology. On gas service, a thermal mass meter covers a naturally wide velocity range.
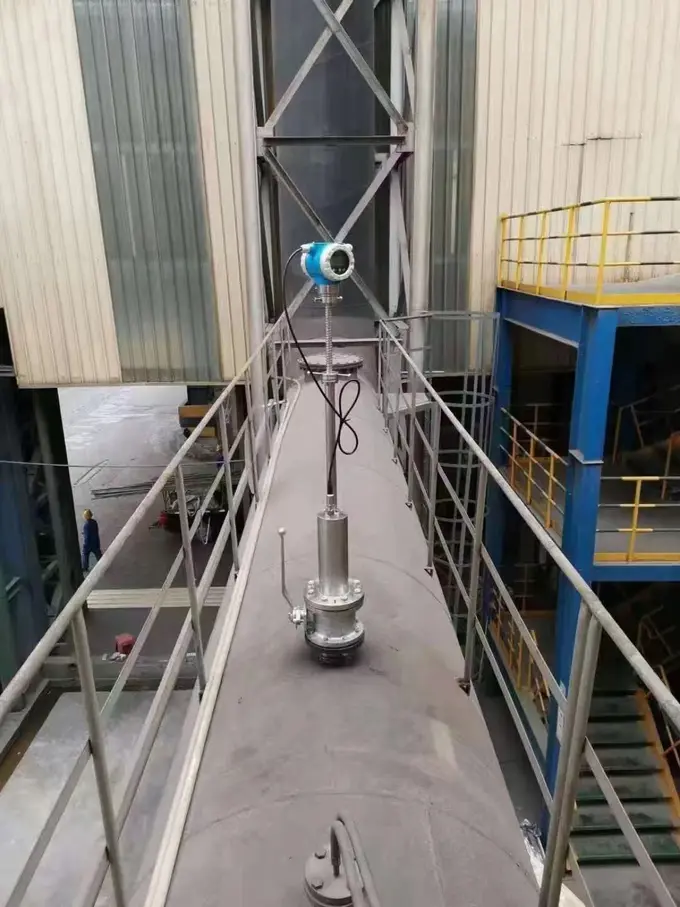
Application example
Oil and gas buyer. A natural gas line at 4 bar and 10 °C needed metering from 50 to 1,000 m³/h: a required turndown of 20:1, at the upper edge of what a gas turbine meter covers. A DN150 gas turbine flow meter was proposed, sized so the 50 m³/h minimum falls inside the measurable band rather than below it. Built-in temperature and pressure compensation reports standard volume, with 3.6 V battery or 24 V DC supply.
Related guides and tools
The turndown table in our flow rate and pressure guide shows the same trade-off from the DP sizing side. The flow meter types overview compares the technologies on all axes at once, not just range. For instruments built for wide-range service, see Coriolis meters. Variable area meters cover simple local indication, and DP transmitters are the case where re-ranging flexibility is the point.
FAQ
What does turndown ratio mean?
It is the ratio of the maximum to the minimum flow a meter can measure while still meeting its accuracy specification. A 10:1 turndown on a meter ranged to 100 m³/h means readings stay within specification down to 10 m³/h. Below that flow the meter may still display numbers, but the specification no longer stands behind them.
What is a good turndown ratio?
Whatever covers your real process range with margin. A steady utility line may be fine at 4:1; a batch line or a gas line with night setback can need 20:1 or more. Compute required turndown from the true maximum and minimum flows first, then match a technology to it, checking the accuracy basis at the low end.
What does a 200:1 turndown ratio mean?
The meter claims valid measurement from full flow down to 1/200th of it. Claims that wide are real for some technologies. The accuracy statement usually changes across the span, though, with a zero-stability or percent-of-full-scale term taking over at the bottom. Read what the error is at 1/200th of range, not just at the top.
What does 10 to 1 turndown mean?
Maximum divided by minimum equals ten: a meter with a 500 m³/h maximum holds its specification down to 50 m³/h. It does not mean the meter reads ten times anything, and it says nothing about accuracy by itself. The same 10:1 is worth more on a percent-of-reading instrument than on a percent-of-full-scale one.
Request a quote
Tell us the real minimum and maximum flow, the fluid, and the accuracy you need at the low end. We will compute the required turndown and propose an instrument that meets it on an accuracy basis you can audit. Reach our application engineers or use the form below.
Written and technically reviewed by Wu Peng and the Instranova engineering team.