By Wu Peng, Senior Process Instrumentation Engineer · Last reviewed September 11, 2026
Compressed air leak detection is the work of finding and tagging individual leaks, normally with an ultrasonic detector that picks up the high frequency turbulence a leak makes. Sizing the total loss is a separate job that needs a flow meter or a receiver test. The US Department of Energy puts leakage in an unmanaged plant at 20 to 30 percent of compressor output, and a system that has never had a leak program will often sit near 20 percent.
Those two jobs get mixed together in most published guidance, and the money hides in the gap. A survey tells you where the leaks are, not what the plant is losing, because it only counts what the technician reached. This guide gives the published leak flow table, the correction factor that cuts it by 39 percent, the arithmetic that turns cfm into money, three ways to measure total leak load, and what an ISO 11011 compressed air audit covers.
Contents
- Two different jobs
- Leak size and flow
- The correction factor
- What a leak costs
- Measuring total leakage
- Audit structure
- Meter placement
- FAQ
Two different jobs
An ultrasonic detector converts the high frequency noise of a turbulent jet, well above the range of human hearing, down into something a technician can hear through headphones. It is the right instrument for compressed air leak detection in the narrow sense: walking a plant and putting a tag on every fitting that hisses.
What it cannot do is tell you the plant total, because the reading at each leak is qualitative unless the technician also estimates the hole size, and because nobody reaches every pipe rack on a single shift.
A flow meter does the opposite. It says nothing about which fitting is bad. It tells you exactly how much air the whole system is drawing at a moment when nothing should be drawing any.
Run the two together and the audit closes. The meter sizes the total, the detector finds the pieces, and the meter afterwards confirms the repair was real. This guide is written from the metering side, which is the side we supply. Ultrasonic locators come from specialists in that instrument.
Leak size and flow
Leak flow through a hole is governed by the area of the hole and the line pressure, so published leak tables are organized that way. The figures below are the US Department of Energy leakage rates in cfm of free air, reprinted from Compressed Air Tip Sheet #3.
| Line pressure | 1/32 in | 1/16 in | 1/8 in | 1/4 in | 3/8 in |
|---|---|---|---|---|---|
| 80 psig | 1.3 | 5.4 | 21.4 | 85.7 | 193 |
| 90 psig | 1.5 | 5.9 | 23.8 | 94.8 | 213 |
| 100 psig | 1.6 | 6.5 | 26.0 | 104 | 234 |
| 125 psig | 2.0 | 7.9 | 31.6 | 126 | 284 |
Leakage in cfm of free air. Source: US Department of Energy, Compressed Air Tip Sheet #3, table used with permission from the Compressed Air Challenge. The 1/64 in column is omitted here for width; it runs 0.33 to 0.49 cfm across the same pressures.
Read across one row and the scaling is exactly what the geometry predicts. A 1/4 in hole is four times the diameter of a 1/16 in hole, so it passes sixteen times the air: at 100 psig the table gives 104 cfm against 6.5 cfm, and 104 divided by 6.5 is 16.0. That square law is the argument for fixing the largest leaks first. Ten quarter inch leaks outrank two hundred pinholes, and no amount of tagging effort changes that ranking.
The correction factor
Under the same table sits a footnote that most people reprint and then ignore: for well rounded orifices multiply the values by 0.97, and for sharp edged orifices multiply by 0.61. Real leaks are cracked fittings, split hose and worn quick disconnects, which behave far closer to sharp edges than to a machined nozzle.
The correction is not a minor adjustment. Taking the table at face value overstates a sharp edged leak by a factor of 1 divided by 0.61, which is 1.64. A published leak cost that looks conservative can therefore be 64 percent too high before any assumption about electricity is made.
There is a good way to check that this is how the source intends the table to be used. The Tip Sheet works a chemical plant example: 100 leaks of 1/32 in and 50 leaks of 1/16 in at 90 psig, plus 10 leaks of 1/4 in at 100 psig, over 7,000 operating hours at $0.05/kWh and 18 kW/100 cfm. Its published answer is $57,069, made up of $5,765, $11,337 and $39,967.
Cost = number of leaks × leakage rate (cfm) × kW/cfm × hours × $/kWh
100 × 1.5 × 0.61 × 0.18 × 7,000 × 0.05 = $5,765
The 0.61 has to be in there for the arithmetic to land on the published figure, and the same factor reproduces the other two lines to the dollar. So the sharp edged correction is part of the method, not an optional refinement. Apply it.
What a leak costs
Take one 1/4 in sharp edged leak on a 100 psig header. The corrected flow is 104 × 0.61, which is 63.4 cfm. At the Department of Energy figure of 18 kW/100 cfm, 8,000 running hours and $0.10/kWh, that single leak costs 63.4 × 0.18 × 8,000 × 0.10, or $9,135 a year.
Then comes the part that almost no published leak calculator handles. The 18 kW/100 cfm belongs to a well loaded machine. Specific power is a property of the compressor room, not of the hole, and it moves a long way with control mode and load.
Compressed Air Challenge figures taken from a CAGI data sheet for a 100 hp, 125 psi machine give 21.3 kW/100 cfm at full load. The same machine at 40 percent load, on load and unload control with one gallon of storage per cfm, runs at roughly 44 kW/100 cfm. Raise storage to ten gallons per cfm and it falls to about 32. A variable speed drive puts it near 23, or 18.7 if the set pressure comes down from 125 psi to 100 psi.
| Compressor condition | kW/100 cfm | Cost of that one leak |
|---|---|---|
| Generic planning figure | 18 | $9,135 |
| Full load, 125 psi, from data sheet | 21.3 | $10,810 |
| Variable speed drive at 40 percent load | 23 | $11,673 |
| Load and unload, 40 percent load, 10 gal/cfm storage | 32 | $16,240 |
| Load and unload, 40 percent load, 1 gal/cfm storage | 44 | $22,331 |
Same 63.4 cfm leak, 8,000 hours, $0.10/kWh. Specific power figures from Compressed Air Challenge analysis of CAGI data for a 100 hp, 125 psi compressor.
Between the top and bottom rows the same hole costs 2.44 times as much. That ratio is worth carrying into any business case, because it means two identical leak surveys at two plants justify very different repair budgets, and a plant with poor part load control saves more from the same repair.
Measuring total leakage
Three methods of compressed air leakage measurement produce a plant number. They need different things and they are worth running against each other.
| Method | What it needs | What it gives |
|---|---|---|
| Load and unload timing | A compressor that cycles on load and unload, a stopwatch, no production | Leakage as a percentage of that compressor’s capacity |
| Receiver pressure decay | Known system volume, a pressure gauge, an isolated system | Leakage in cfm of free air, one snapshot |
| Header flow meter baseline | A meter on the main header and a window with no production | Continuous leak load, trended, and repair verification |
The first is the Compressed Air Challenge cycle time method. Run the plant down, leave the compressor on, and time it.
Leakage (%) = (T × 100) / (T + t)
T = 3.2 min on load, t = 6.8 min off load: (3.2 × 100) / 10 = 32 percent
On a 500 cfm compressor that is 160 cfm going nowhere. At 18 kW/100 cfm, 8,000 hours and $0.10/kWh it is $23,040 a year.
The second isolates the system and watches the pressure fall. The multiplier of 1.25 in the published form corrects the result back to normal system pressure, since leakage falls as the system empties.
Leakage (cfm free air) = (V × (P1 − P2) / (T × 14.7)) × 1.25
V = 300 ft³, P1 = 100 psig, P2 = 50 psig, T = 15 min: (300 × 50 / 220.5) × 1.25 = 85.0 cfm
The third is a flow meter on the header, read during a shift when nothing is running. A thermal mass meter reading 145 m³/h of free air converts to 145 × 35.3147 / 60, which is 85.3 cfm. That is within one percent of the decay test on the same system, and two independent methods agreeing is what turns a number into something a plant manager will sign.
On a 500 cfm plant, 85 cfm is 17 percent of capacity. That sits inside the 15 to 50 percent band Compressed Air Challenge reports for working plants, and above the 5 to 10 percent the Department of Energy sourcebook treats as achievable after a repair program.
Before trusting any baseline, valve off the loads that legitimately run off shift, such as air operated diaphragm pumps on sumps and continuous blowing nozzles, or the number becomes leak load plus night shift. Working in normal cubic meters rather than actual cubic meters matters here too, and the difference is set out in our note on flow rate units.
Audit structure
ISO 11011:2013, titled Compressed air, energy efficiency, assessment, is the standard that says what a compressed air assessment has to contain. It treats the system as three functional subsystems: supply, the conversion of primary energy into compressed air; transmission, the movement of that air from where it is made to where it is used; and demand, every consumer, including productive end uses and every form of waste.
The standard also sets requirements for analyzing the data, reporting the findings, estimating the saving, and defining who is responsible for each part of the assessment. The word used throughout is assessment; in the field the same exercise is called a compressed air audit.
Two details belong in a report. The standard is a single 51 page document with no parts, published in September 2013 and confirmed in 2020. As of August 2026 it carries the ISO stage that marks a standard to be revised, and a new edition is in development. An assessment report should therefore name the edition it was written against rather than the bare number.
Leak survey cadence also differs by source. The Compressed Air Challenge article that carries these formulas says the tests should be carried out quarterly. The Department of Energy sourcebook version of the same fact sheet says only that they should be part of a regular program, without naming a period.
Leakage sits squarely in the demand subsystem, which is why a leak number that comes from a header meter fits an ISO 11011 style report better than a tally of tagged fittings. The tally is evidence of work done. The meter trend is evidence of an outcome.
Meter placement
Put the permanent meter on the main header downstream of the dryer and final filters, where the air is clean and dry and the reading represents everything the plant draws. Thermal mass meters are the usual choice because they measure mass or standard volume directly. No separate pressure and temperature correction is needed, which counts when header pressure swings through the control band.
Our page on the compressed air flow meter covers the sizing and the ranges, and the thermal mass flow meters hub compares the inline and insertion builds. On a large header, an insertion meter can be hot tapped without shutting the plant down.
Volumetric instruments can do the same job provided the density reference is handled properly. The reasoning is set out in pressure and temperature compensation and in mass flow against volumetric flow. For accountability by department, meter the branches as well as the header, so a rising baseline can be traced to an area instead of to the plant.
Pair the meter with a totalizer if the plan is to bill or benchmark by volume. The difference between the two functions is covered in flow totalizer against flow meter, and line sizing for the meter run can be checked with the pipe velocity calculator.
Application example
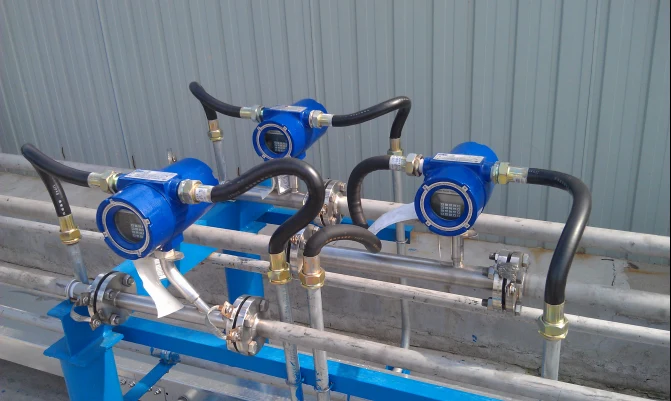
Manufacturing plant, Philippines. The plant wanted air consumption measured on its small and medium branch lines rather than only at the compressor room, so each machine could be checked against its rated demand. A thermal mass flow meter was proposed for a 2 in (DN50) branch carrying about 50 cfm, reading standard volume directly with no separate pressure and temperature correction. Branch metering of this kind is what makes an off shift baseline attributable to an area.
After the repairs, re baseline in the same window with the same loads valved off. A leak program that never re measures cannot say whether the tagged leaks were fixed. Published experience is that leakage climbs back once attention moves on, which is the argument for a permanent meter rather than a one time survey.
FAQ
How to detect compressed air leaks?
Walk the system with an ultrasonic detector, which converts the high frequency turbulence of a jet into audible sound, and tag each leak with its location and estimated size. Soap solution works for accessible joints. Neither method gives a plant total, so pair the survey with a header flow meter reading or a receiver test.
How can I test for a leak in my air compressor?
Stop production, leave the compressor running, and time its loaded and unloaded periods over several cycles. Leakage as a percentage of that compressor’s capacity is (T × 100) / (T + t), where T is loaded time and t is unloaded time. A reading above about 10 percent indicates the system can be improved.
How to calculate compressed air leakage?
Either from the leak inventory or from a system test. From the inventory, take the published cfm for each hole size at your line pressure, multiply by 0.61 for sharp edged leaks, and add them up. From the system, use the cycle time method, a receiver pressure decay test, or a header meter read with no production running.
Is there a tool to detect air leaks?
Yes. Handheld ultrasonic detectors and acoustic imaging cameras are the standard instruments for locating leaks, and they are sold by specialists in that instrument. What they do not do is quantify the plant total, which is the flow meter’s job, so most audit programs use one of each.
Which flow meter suits a compressed air header?
A thermal mass meter for most headers, because it reads mass or standard volume directly across a swinging header pressure. Use an inline body up to about DN80 and an insertion probe on larger mains, where it can also be fitted through a hot tap without a shutdown.
Request a quote
Tell us the header size, the line pressure, the compressor capacity and whether you want a permanent baseline or a portable check, and we will size the meter for the measurement you need. Reach our application engineers or use the form below.
Written and technically reviewed by Wu Peng and the Instranova engineering team.